One of Link’s main differentials is that we prioritize the delivery of differentiated custom reports for each employee. But how exactly do they work? Find out now!
Making and analyzing reports is the best way to get to know the company as a whole and plan strategies; often, the root of mismanagement is precisely a misuse of reports (or lack of usage).
Do you want to know how a good use of custom reports can change the routine of your company and also save your time and the time of your employees? Read the article!
WHAT A CUSTOM REPORT IS
A custom report is a display of data, information, results, or descriptions of activities performed, all systematically and coherently. These reports can be highly customizable, and how the information will be displayed is highly dependent on each report. For example, more quantitative reports may have more graphics and percentages, while more qualitative reports may have more tables and texts.

However, it is quite useless if the production of the report is useful only on paper. There are a few steps to creating an exceptional report (that really works) and we follow them to the letter:
- Present data in a meaningful way, including the most important information.
- Add information that helps people make assertive and more informed decisions.
- Use simple language that everyone can understand, avoiding slang or jargon.
- Keep it simple. Make sure everyone can understand your message.
- It is necessary to have criteria for choosing performance indicators. The use of KPIs (Key Performance Indicator) more appropriate to real analytical needs makes the report more consistent and objective.
A report may be required to present different information, and depending on the company, it can be requested as a weekly, monthly or annual routine in order to present work’s results.
WHAT A CUSTOM REPORT IS FOR
In general, a personalized report can be related to any area of the company, as well as its development and activities. Therefore, its functionalities vary greatly from report to report.
Therefore, management reports are essential for the maintenance and growth of the organization. In addition to adding precision and agility to decision-making, these documents also ensure the recording of important activities and data.
The purpose of the report is the first issue to be worked on in the drafting process. The objective must be very well defined to avoid confusion.
HOW TO IMPLEMENT THE CUSTOM REPORTS IN YOUR COMPANY
One of the strategies that Link implements in companies is Information or Management and Reporting, and for that, we identify the most important KPIs for your business and integrate them into an interactive Power BI platform that automates and distributes custom reports (who sees what and how often).
These reports modify the flow of information and results, as often, the employees have access to reports that do not relate to their demands, areas, or tasks. Targeting reports more accurately saves time and still gets your employees focused on what’s important for them.
But to better understand how this process works, it is important to know what the KPIs and the Power BI Platform are all about, and how it is going to maximize time in the production of reports and make them more assertive and indispensable.
WHAT ARE KPIs AND WHY THEY ARE IMPORTANT?
Key performance indicators (KPIs) are tools of measurement used to monitor the progress toward achieving the company’s aims. It tracks how effectively an organization is performing against that objective, including associated targets or goals, so that companies use KPIs to bring about performance improvements that drive growth.
This being said, it is very important not to confuse goals with KPIs. Goals are more open, less planned, and condensed. KPIs or metrics, on the other hand, refer to the level of progress that you track as part of executing your strategic plan. They are more measurable and clearly defined than goals.
The choice of data used in the report must be made judiciously. Only relevant and highly reliable information should be used. Structuring a model for management reports is essential to add a functional and efficient standard to future analyses; selecting those responsible for each step of the reporting process is important to maintain operational control and ensure that all quality factors are met.
The presentation of the report must be done in an intelligent and strategic way, considering the target audience, the volume of data, sequence of information, importance of the results, format, language, date, etc.
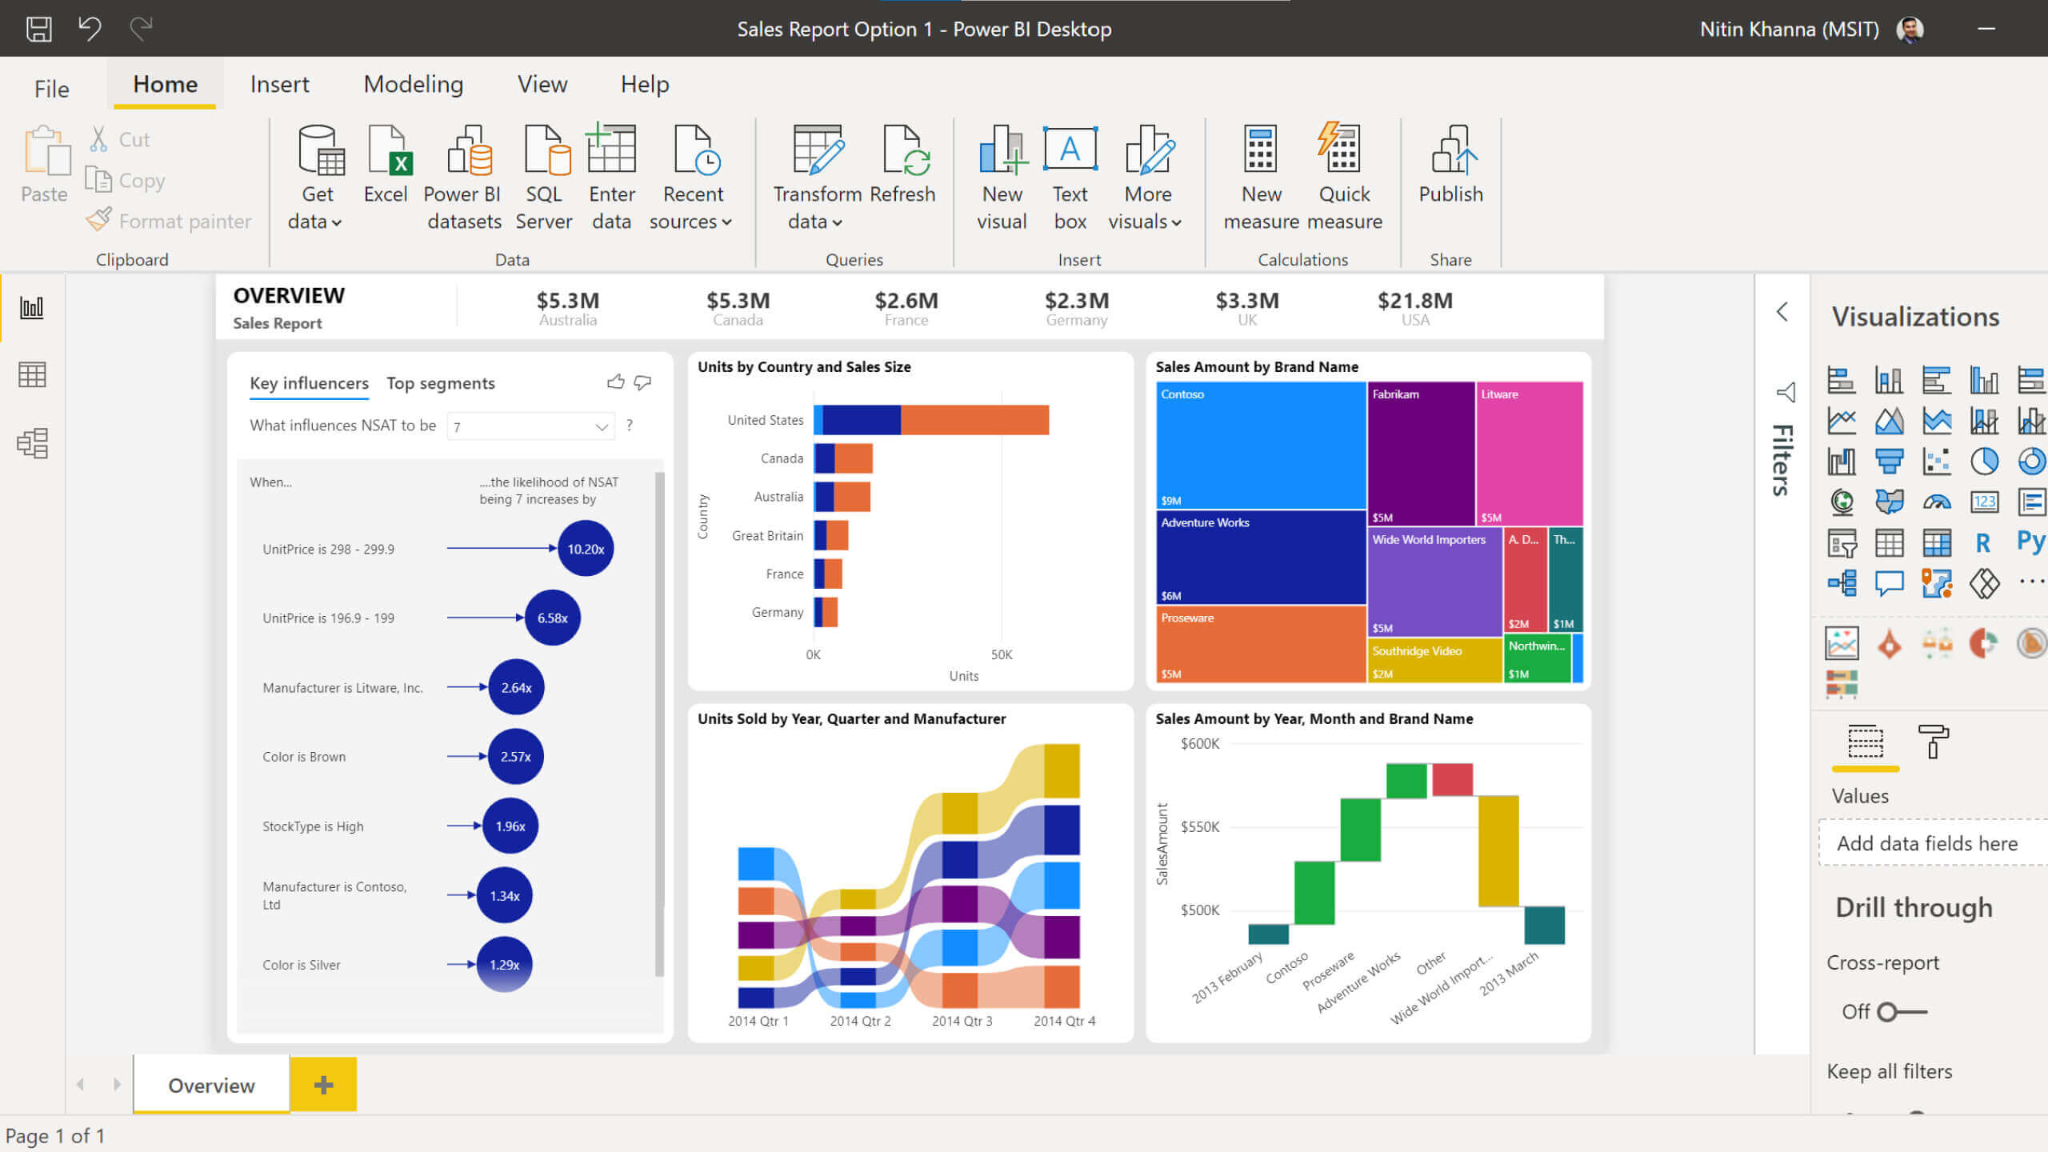
Microsoft Power BI: An example of how a custom report KPI may seem like
DIFFERENT CATEGORIES OF PERFORMANCE INDICATORS
With so many possibilities for analysis, the company must keep in mind what is fundamental (or keys) to its business. Below are some of the main categories of KPIs:
Productivity indicators
These tools are continuously applied in business management to evaluate the performance and efficiency of processes in companies. Briefly, they act to measure the number of resources that a company uses to generate a certain product and/or service.
Quality Indicators
They follow the productivity indicators, as they help in the analysis of any unforeseen events or errors that occurred during a production process.
Capacity indicators
These analyze the responsiveness of a process through the relationship between the outputs produced per unit of time. Combined with productivity and quality, they demonstrate how competitive the company is.
Strategic indicators
Strategic KPIs provide information on how the enterprise is doing concerning previously defined goals. They provide a comparison between the company’s current scenario and the expected one. In other words, they measure “where” things are.
WHY ARE KPIS IMPORTANT TO YOUR BUSINESS?
We all have goals, especially in the corporative world. And, in this scenario, it is common to suffer disappointment for not achieving these goals. In this context, KPIs are critical to analyzing progress toward established aims. They are going to identify specific actions and behaviors that will guide you towards success.
Many factors lead to the achievement of a goal, and it is difficult to identify the most critical ones. Unless they are being tracked, which is precisely the role of KPIs. Not to mention, if you’re not looking at something, how can you know if it’s progressing or just stagnating? Determining key metrics for achieving your goals and using KPIs to track your progress will ensure nothing gets out of hand.
Furthermore, using KPIs make it possible to present the progress towards the objective to everyone involved, demonstrating each victory obtained. On the other hand, it also helps to demonstrate how much remains to be done, raising awareness and engaging those involved.
Using KPIs also promotes a learning atmosphere in any team. After all, observing the generated data promotes critical conversations about progress and achievement of goals. Another advantage of KPIs is that they promote long-term strategic goals. Therefore, they are essential to maintain consistency over time. Whether to measure your production capacity or your results, defining and monitoring your KPIs is an essential step towards achieving your goals. So, if you don’t have these well-established KPIs yet, you must start choosing them. But remember: these ratios need to lead to actionable steps to reach a goal.
Another important factor is where to create and distribute these reports, and that’s exactly what we’ll elucidate now.
THE POWER BI PLATFORM
Faced with the need to interpret a large volume of data, companies began to look for solutions that would simplify this alignment process. Thus, new business intelligence tools such as Microsoft Power BI were developed and adopted, enabling the collection, treatment, and structuring of all information in a single custom report.
Being a software with modern data analysis and idea-sharing capabilities, Microsoft Power BI stands out in its category for delivering more efficiency, quality, and unprecedented advantages offered exclusively by Microsoft.
Ensuring more productivity and optimization of expedients, the implementation of Microsoft Power BI helps the company to synthesize and centralize information from different sources, providing them in super creative, immersive, and interactive presentations.
Suitable for any department or corporate level, Microsoft Power BI helps all employees to display and display data in a complete, differentiated, and updated way (in real-time!).
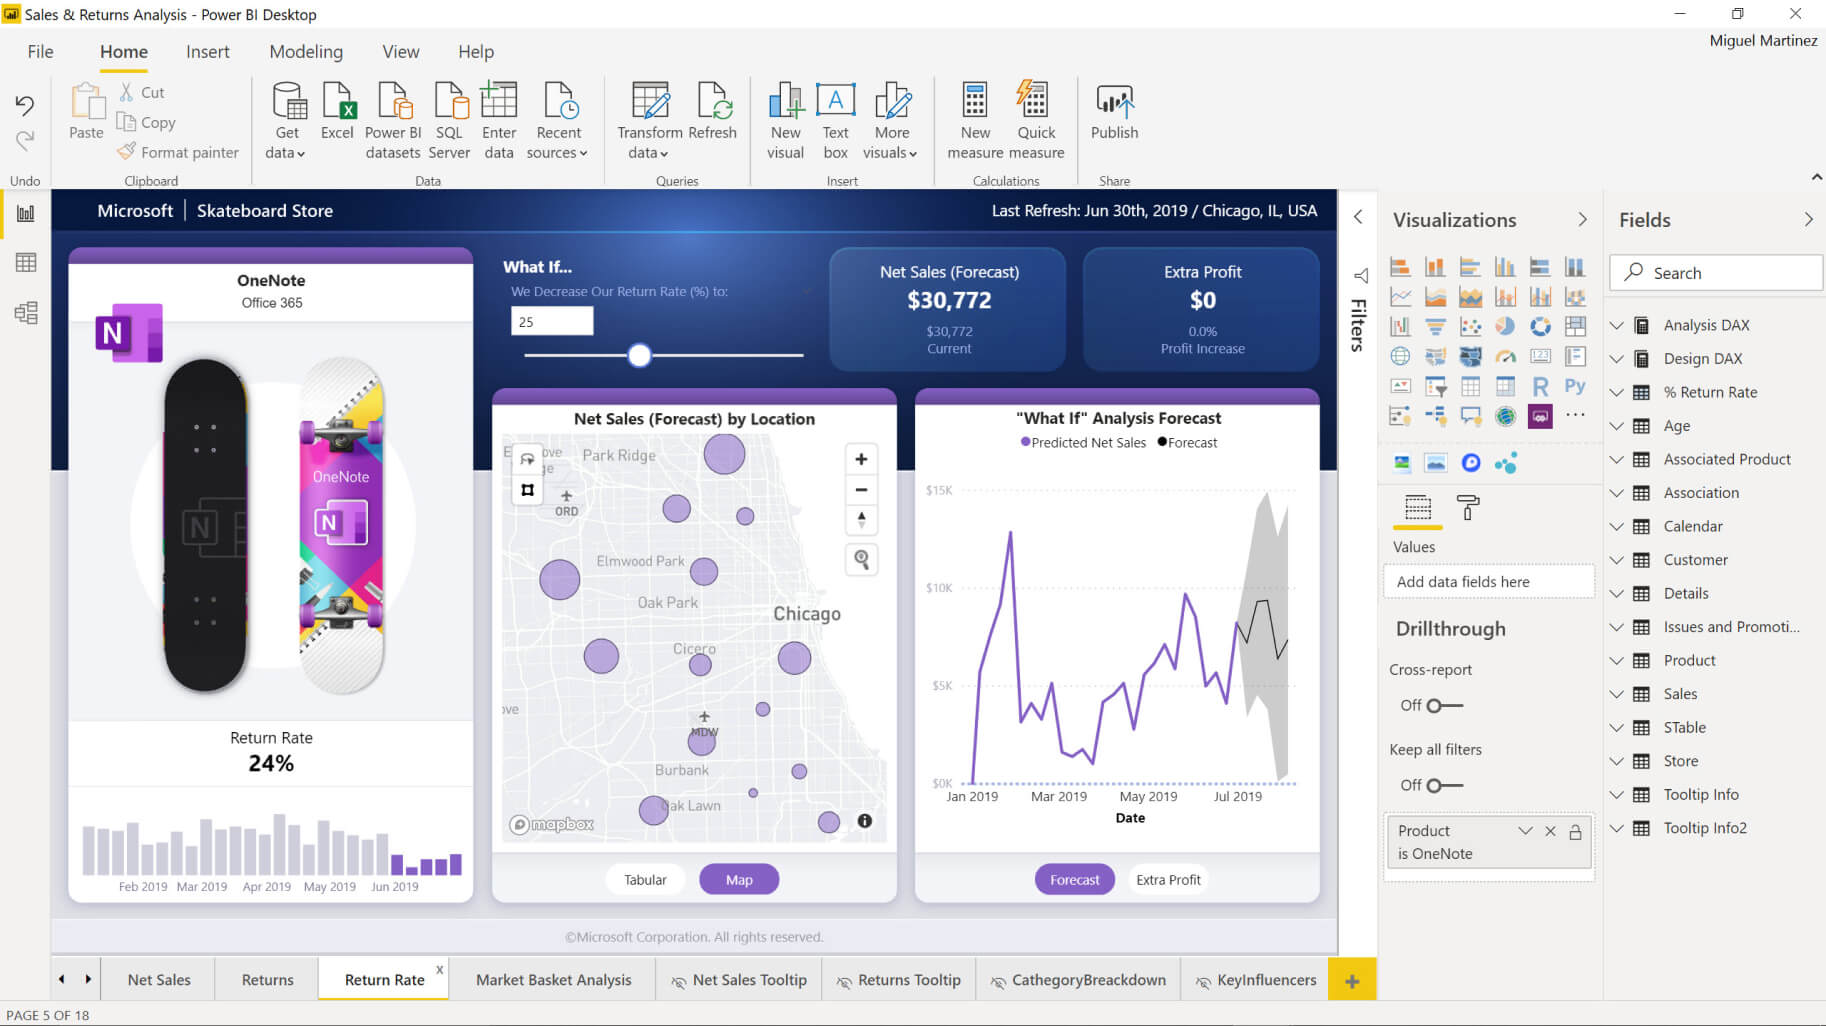
The layout of the Platform. Source: Microsoft Power BI Brazil.
WHAT IS POWER BI?
Microsoft’s business intelligence tool, Power BI is a collection of business analysis services that mainly contribute to a better collection, synthesis, and dissemination of data by the end-user. By first enabling the connection of information from different matrices — from Excel spreadsheets and folders to files stored in the cloud — Microsoft Power BI makes it easy to group, filter, and show numbers, statistics, values, lists, graphs, and other materials in a simple and intuitive interface.
To facilitate the visualization of diverse data in a single dashboard, Power BI seeks to promote greater involvement of the spectator or customer with the way this information is presented.
Microsoft Power BI, in the best self-service program style, reduces complexities by providing and adapting the responses of its advanced panels to any device (smartphones, computers, tablets, etc).
Promoting more coherence, more engaging visuals, and more attractive displays, the platform also allows for the sharing of insights, the automation of processes, the development of solutions, as well as the creation of virtual agents.
It is also worth mentioning that Power BI is a fundamental part of the Microsoft Power Platform (a platform of complementary Microsoft applications that empower companies’ deliverability), enhancing its resources by integrating with the other software services: Power Apps, Power Automate, and Power Virtual Agents.
WHAT ARE THE BENEFITS OF POWER BI?
Going beyond the daily facilities provided by the platform, other notable benefits of Microsoft Power BI are:
Easy implantation
Thanks to its affordable system, Microsoft Power BI can be installed in companies with little or no help from IT professionals — so its use can be started almost instantly after the decision to use the tool.
Accessibility
Compatible with different mobile devices and operating systems (Windows, iOS, and Android), the accessibility and navigation of Microsoft Power BI are fully adaptable — allowing any user, as long as authorized, to carry out analysis of material wherever they are, in real-time.
360º perspective of the organization with Microsoft Power BI
Qualified to serve all departments of the same company, Microsoft Power BI can act in the most diverse commercial areas (finance, sales, marketing, human resources, among others), adapting itself according to your specific demands.
Real-time information
The monitoring of data analyzed by Microsoft Power BI is performed in real-time. In this way, even though the information is constantly changing, the data is updated along with its changes.
More cost-effective with Power BI
Licensed by subscription and with monthly payments (made only when the user is ready to share and scale their reports), Power BI presents packages with values compatible with the amount of functionality offered.
The Microsoft solution also has a free version available for use, for reading published reports and creating dashboards, thus allowing everyone to test and learn about Power BI.
User community focused on Microsoft Power BI
The software has a special space for the formation of a community of Microsoft Power BI users from the same region. Once the group is formed, it is possible to exchange experiences, share learning and talk about the platform’s news.
Full Microsoft Support
Clearing doubts via chat or phone, Microsoft offers full support to Power BI users to clarify further doubts, at no extra cost.
IN CONCLUSION
With the advancement of technologies, for some time now, the amount of data generated around the world has increased considerably — and keeping up with it has been a challenge for many organizations. Link is a company that works simplifying processes, improving performance, reducing total costs, maximizing results, and increasing your company’s competitiveness.
In addition to being a strong believer in the positive feedback from custom reports, we’ve seen closely, as a result of several clients, that the KPI reports made and delivered on the Power BI platform were accurate in their objectives.
Contact us for more information!